
Descriptive, Diagnostic, Predictive, Prescriptive Analysis
In general, there are 4 stages of analysis, results ranging from hindsight to foresight. The easiness level and value created also different in each stage.
The simpler analysis takes shorter time but the value can be just nice, however it takes longer time to develop foresight types of analysis, and of course the business impact in term of revenue and changes also very high. Also to note that analytics types are not measured by number of visualizations; descriptive analytics can be many outputs and attractive, whereas prescriptive analytics may have only one page of bar charts to represent result.
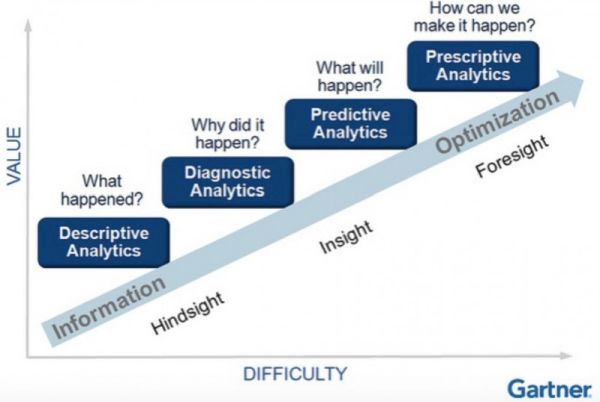
Descriptive – periodic report, information tells what happened in the past
Diagnostic – explorative and multiple perspective, answering what caused the trends
Predictive – it can be estimation, machine learning, or simulation, try to get a closer answer of the future outcome
Prescriptive – shed the light for the action to solve the problem. It starts with business motive; discovery drive the direction of action and then it must be supported by the process changes in business. All three aspects have to work hand in hand to see significant business impact.
There are examples in the visualization below, 4 different types of analysis which showcase the respective stages.
Dataset
A set for processed sales transaction data comprises Date, Category, Sub-Category, Product, Customer Name, Region, Sales, Profit. This dataset has 4 years of sales transactions and data is loaded into Power BI to illustrate analysis types as mentioned above.
Analysis
We want to use the data to tell the story, starting with what had happened in the past, to explore the alerting area, simulate and forecast with the relevant variables and suggest some workable action. In each visual page, mouseover to the information icon for a brief overview.
In Descriptive page, information from charts:
Trending - year 2021 sales is the highest and 2024 is lower than the previous years
Profit margin of 2024 is the lowest
Technology category provides the largest sales value, followed by Furniture and Office Supplies
Alert for sales revenue and profit margin
In Diagnostic page, the discovery via analysis:
Issue of low profit products - sub-category 'Table' and 'Bookcases' with high revenue but produced negative margin (at loss), and bring down the overall profit
Other factors that cause low sales results - 'E.Coast' region generates very low profit margin when comparing to others
In Prediction page, we used simulation and forecasting. Forecasting ignores the latest incomplete month. Mouseover to view forecasting area value.
We forecast the next 90 days sales with in-built ML algorithm
Then simulate and forecast the profit margin without involving sub-category Table
Forecast shows sales does not change much but overall profit margin is improving without selling unprofitable 'Table'
In Prescription page, assuming company allocates large marketing fund to boost the sales after knowing the alerting sales trend and profit margin, we want to identify which action could be more significant? Two options from analysis:
Target the right products - the sales momentum of Category 'Office Supplies' and 'Technology' are trending down, need more fund for sales campaign compared to ‘Furniture’.
Customer base - sales was mostly generated from older acquired customers, new customers do not contribute much to sales. Urgently to acquire higher quality customers as action.
Summary
Hopefully the above examples give you an idea how the analysis look and feel. While moving from descriptive to prescriptive types of analyis, the focus is also shifted from regular reporting, to address tactical issues, then to strategy oriented solution. In terms of data science aspect, the emphasis is slowly changed from data and technical intensive to tackle business pain points and practices improvement.