
Tableau 10
It’s been awhile since last blog entry. Tableau 10 has entirely new look and feel with beautiful fonts and colors which make your viz shine more than previous!
For Tableau user whom have use Tableau version before 10.0 will surely has a ’Woah’ blow up in your mind with totally new look and more simpler than previous version. For starters, it is way easier for you to get started on some simple viz without any guidance by just few exploring click! Let’s get explore what new feature and enhancements do Tableau 10.0 have for us!
Fresh Look and Feel

As I just mention just now, clean and simple are what Tableau 10.0 have for us in the first sight. Before Tableau 10, you need to find a font which suit all devices and operating systems. But Tableau 10 now features a custom font that makes your text crisp, clear, and communicative—even at small sizes. Besides, you can enjoy cleaner, inline titles that complement your viz.

Another new feature in Tableau 10 is workbook level formatting. This means that you don’t have to copy or set the formatting for each individual sheet but set the font of your whole workbook with a click.

Not just the font have changes, Table Calculation have become more simple and easier to use compare to previous version. User (for starter as well) can easily use it with the first sight!
More New Visual Analytics Capabilities
In Tableau 10, you can filter across multiple data sources! Let say you have multiple data sources, each have common dimensions like date, product or location. You main purpose in your analysis is to have a single filter which can apply across all the sources. If for previous Tableau version this will be tricky to reach the part where user can analyze the viz which contain multiple data source with one filter. In Tableau 10, you can filter across the data sets which share a common dimension.
Motion Picture credit to Tableau
If you are intend to make a simple statistical analysis like clustering, Tableau 10 provide a quickly spot patterns and group your data with drag-and-drop cluster analysis which is more easier than before without any other statistical analysis program. Tableau uses k-means as the method, one of the most robust clustering techniques, and can either automatically generate the clusters or you can suggest the number of clusters you’d like.
Motion Picture credit to Tableau
Take your groups farther. You can now use groups in calculated fields. The previous solution to this issue would be a long-winded approach like going back to the datasource to generate a new column in the datasource or writing out very lengthy IF statements. Now just drag a newly generated group into a calculation and get going. User can include groups in LOD calculation as well!
Data Breakthroughs
In real life, it is impossible to find answer from a single data set. Multiple sets of data are involved to find out your business solution. This is why Tableau are excited to show one of their new feature - Cross-database join. You can join data from different sources, like SQL Server and Oracle.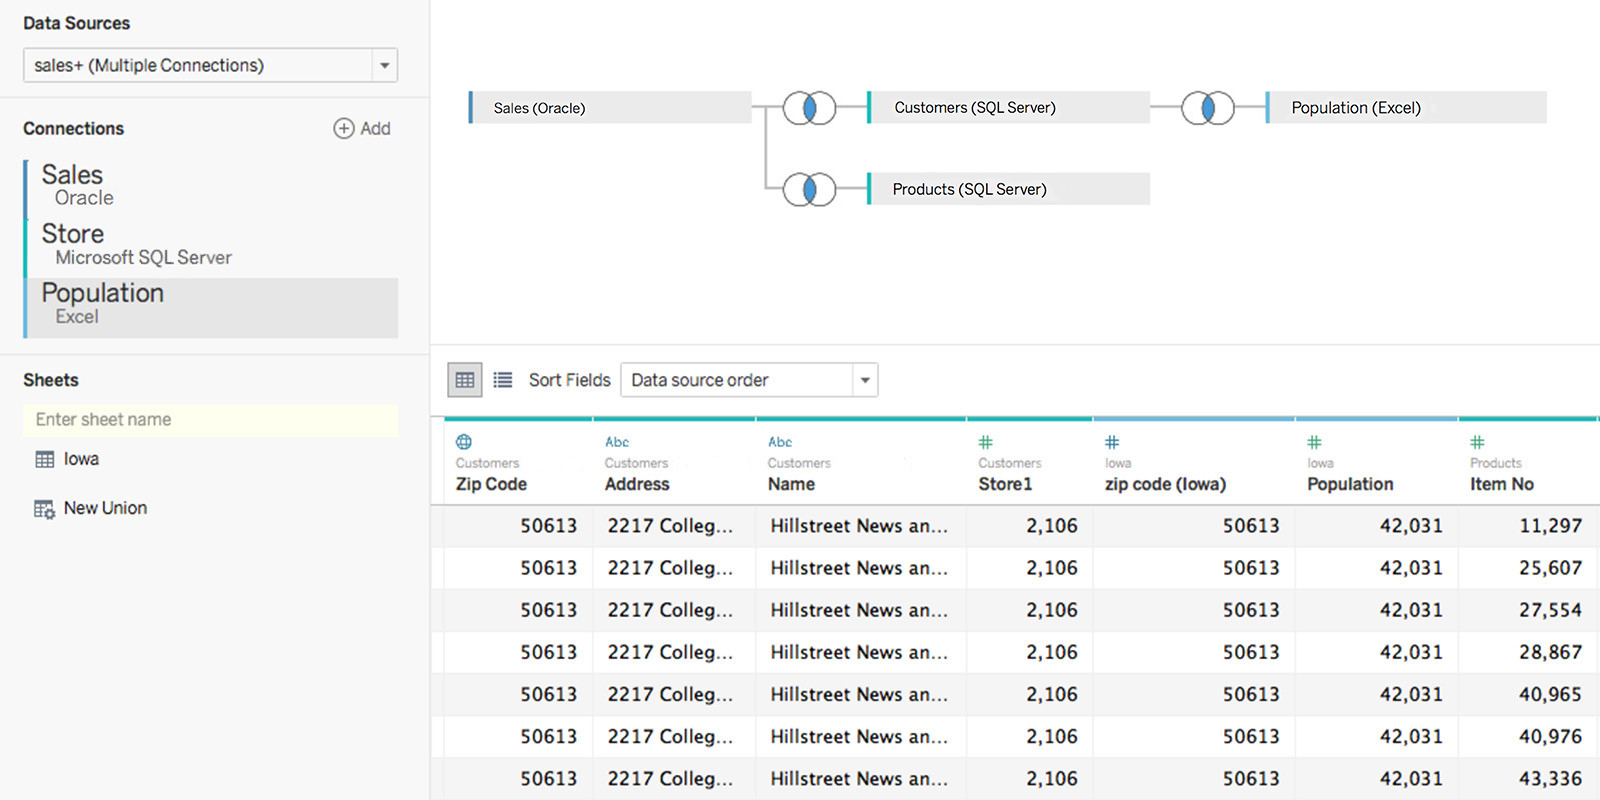
Picture credit to Tableau
These are just our favorites and there are many more little improvements in version 10 and 10.x that not mentioned in this blog entry.
You can get a free 14 trial days of Tableau Desktop 10 to know what answer you will find with you data!
Let us know if you need any demonstration or consultation by contact us!